Announcement at the beginning
This event is part of London Data Week 2026, a public citywide data festival. To learn more or please visit londondataweek.org.
We are very grateful to the London City Hall for hosting this evening and their hospitality.
Workshop details
| Date | Monday, 6 July 2026 |
|---|---|
| Time | 10:00 - 12:00 |
| Location | London City Hall, Kamal Chunchie Way, London E16 1ZE, UK |
| Event page | https://luma.com/3cq829o7 |
Summary
This hands-on, collaborative workshop invites Londoners to step into the role of urban data analysts to examine the city’s air quality. Utilising open-access datasets from the London Air Quality Network (LAQN) and local monitoring centres, participants will map pollution hotspots, trace historical trends across different boroughs and investigate the micro-effects of local traffic and green infrastructure.
The event acts as a bridge between hard environmental science and local community experience. Participants will work in small teams to look at the data, draw insights about their own neighbourhoods, and collaboratively draft data-driven recommendations for cleaner borough streets. Rather than viewing air pollution solely as an environmental problem, the workshop introduces participants to the idea that air quality is an emergent property of London’s wider urban system. Participants will be encouraged to consider how infrastructure investment, transport planning, and urban design can contribute to healthier and more liveable communities.
Why study air quality?
Air pollution
- is one of the leading environmental
risks to human health, contributing to
respiratory disease, cardiovascular disease and other chronic health
conditions.
- Air pollution is not distributed
evenly across London.
- Exposure varies between boroughs, neighbourhoods, individual streets
and different times of day.
- Exposure varies between boroughs, neighbourhoods, individual streets
and different times of day.
Designing Liveable Cities
- Understanding where pollution occurs is essential for designing healthier and more liveable
cities.
- Open environmental data now allow anyone, not just researchers or government agencies, to investigate air quality in their own communities.
Maps and Data Visualisations
- Maps and Data Visualisations transform complex
datasets into evidence that can inform public
discussion, policy and local decision making.
- Data do not provide answers on
their own.
- They help us formulate hypotheses, identify patterns and ask better questions about how cities function.
Air Pollution is an Emergent Property
- Air quality is an emergent property
of London’s urban system.
- It arises from the interaction of
- transport,
- land use,
- economic activity,
- green blue and grey infrastructure and
- weather
- fluid dynamics
- rather than from any single factor.
- It arises from the interaction of
Why is air pollution so difficult to understand?
Multiple Source, Multiple Effects, Multiple Pathways
- There is no single source of
urban air pollution.
- Road transport,
- domestic heating,
- airports, construction,
- industry and
- shipping
all contribute to the air that Londoners breathe.
- Each urban activity emits
several pollutants simultaneously. For example,
- road transport emits nitrogen oxides,
- particulate matter,
- black carbon,
- carbon monoxide and
- volatile organic compounds.
- Each pollutant can originate from multiple
sources.
- Fine particulate matter (PM₂.₅), for example,
is produced by
- traffic,
- domestic heating,
- aviation,
- industry and
- regional transport.
- Some pollutants are formed after they are emitted.
- Ground-level ozone and secondary particulate matter are created
through chemical reactions in the atmosphere, making pollution dependent
on both emissions and weather conditions.
- Ground-level ozone and secondary particulate matter are created
through chemical reactions in the atmosphere, making pollution dependent
on both emissions and weather conditions.
- Fine particulate matter (PM₂.₅), for example,
is produced by
Health Effects
- Different pollutants affect the
human body in different ways.
- Some primarily damage the respiratory system, others increase the risk of cardiovascular disease, while many contribute to several health conditions simultaneously.
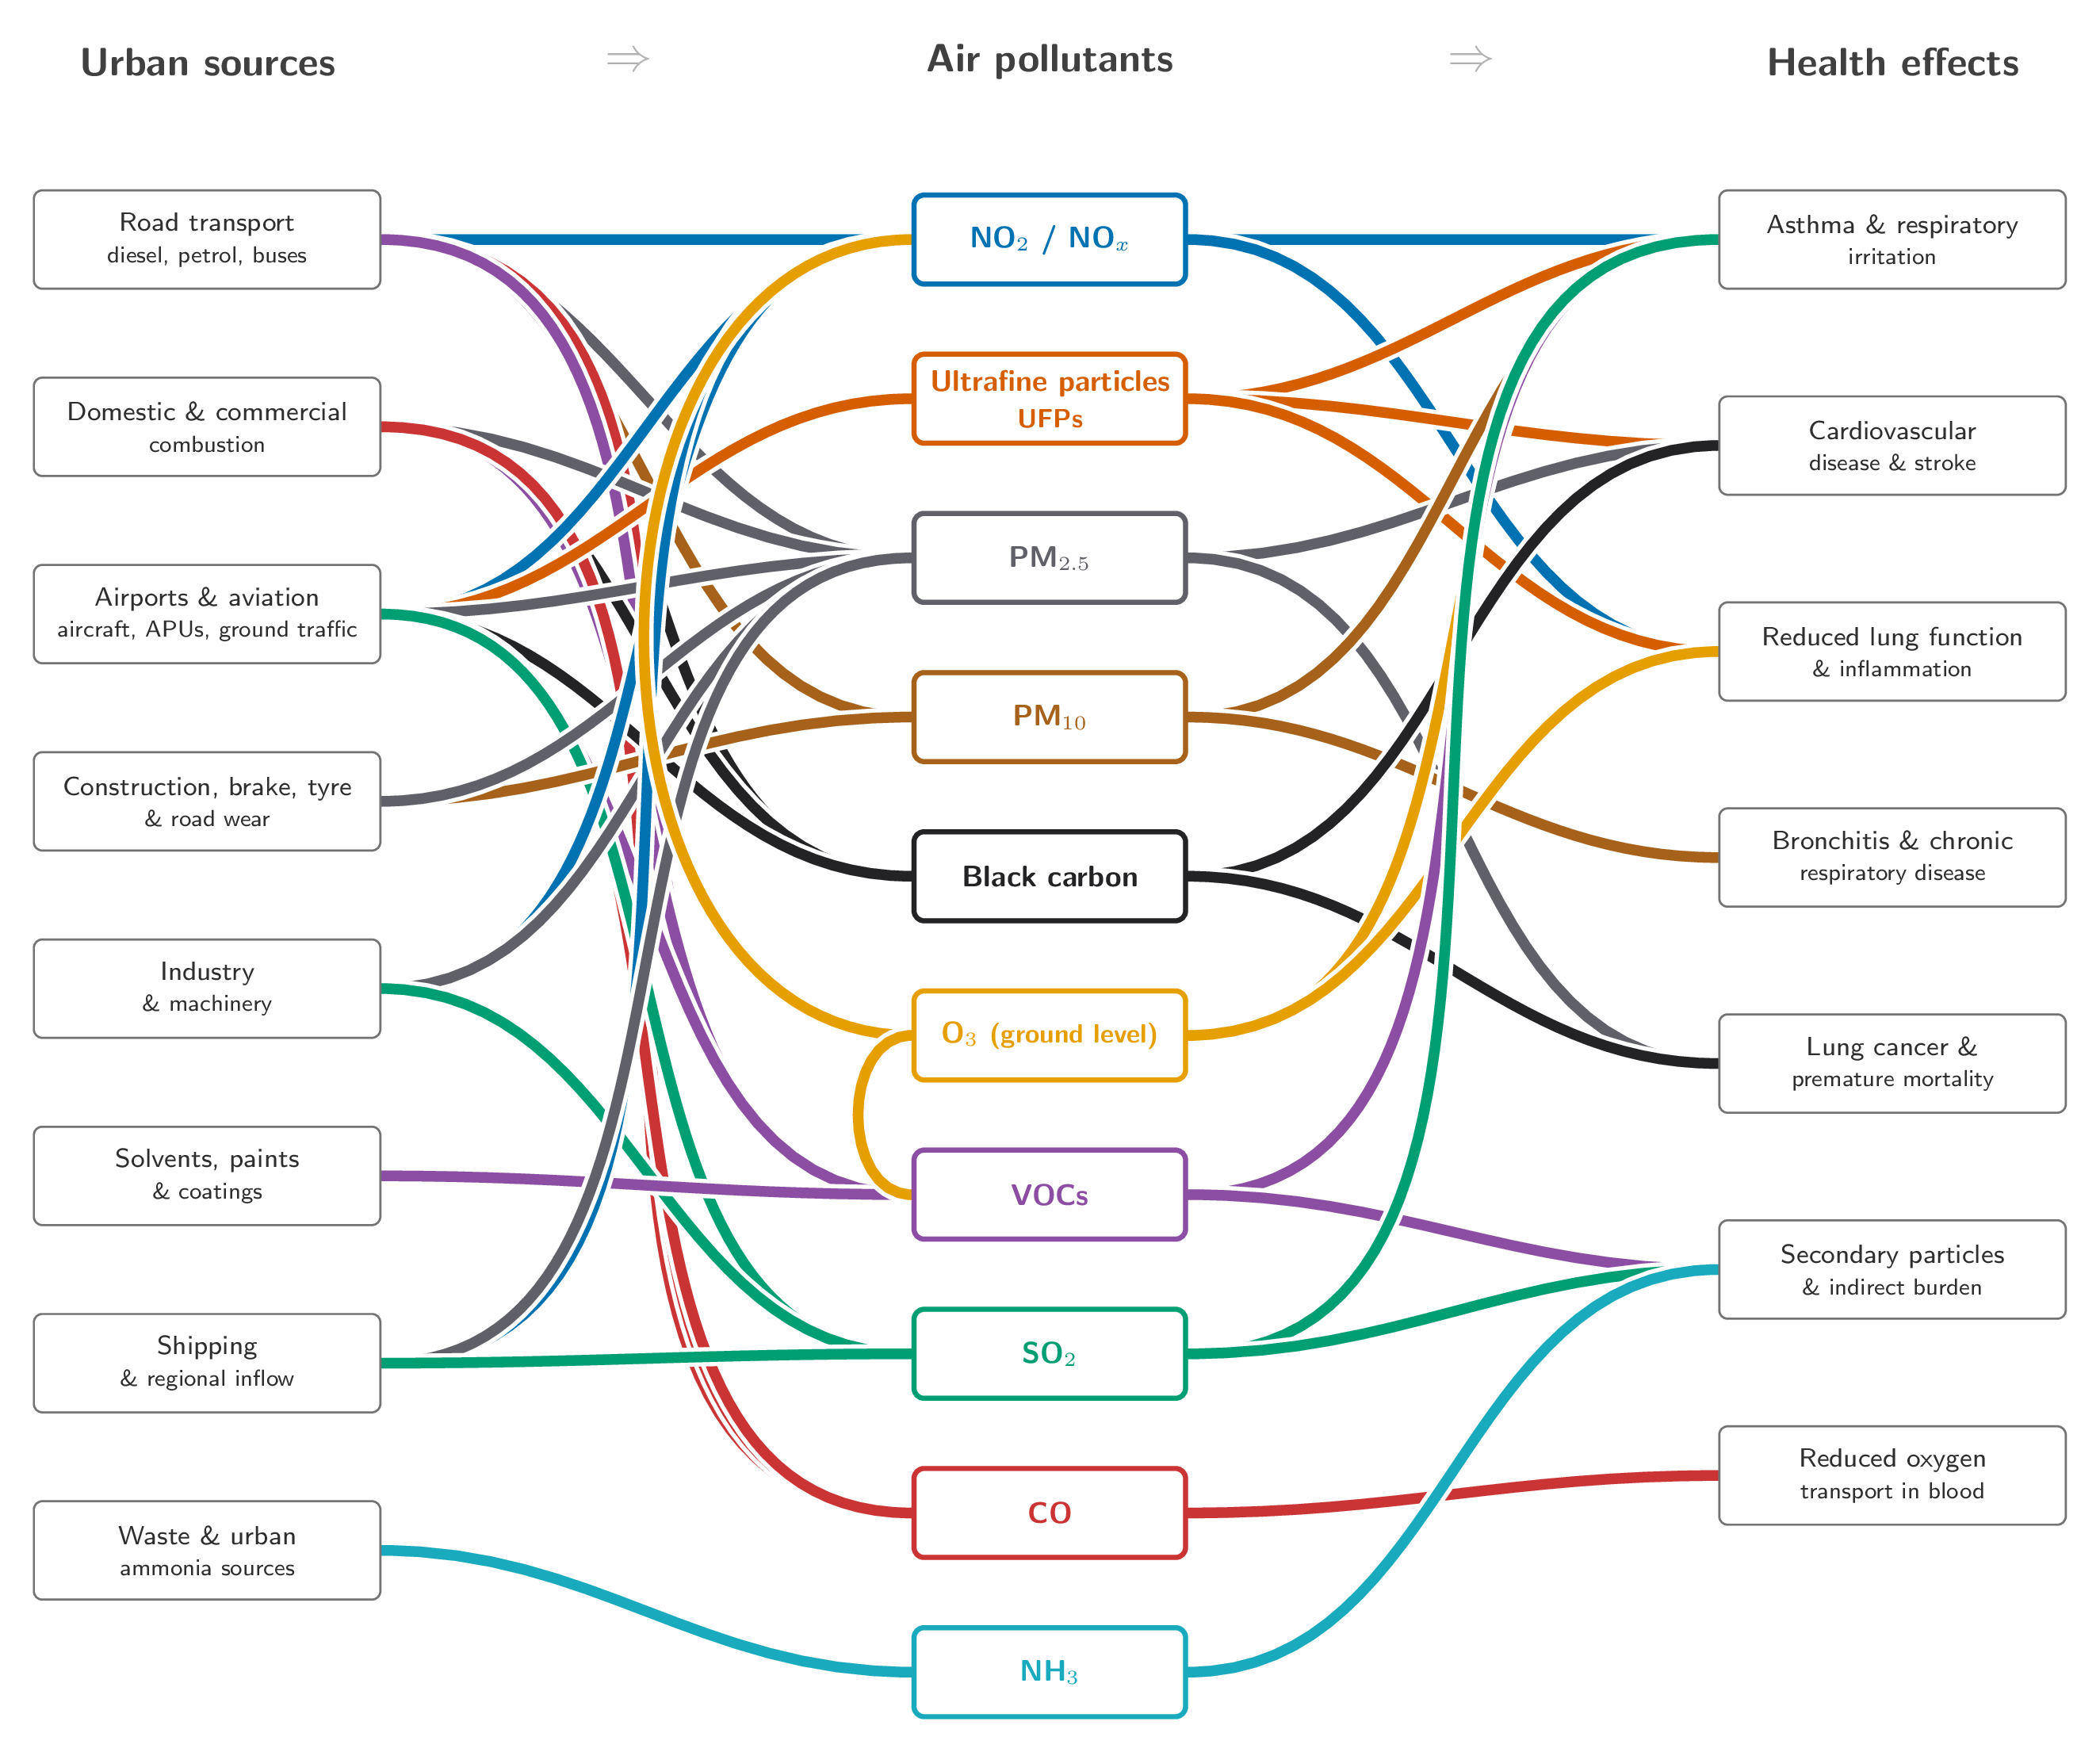
Many-to-many Relationship
- The relationship between
sources, pollutants and health
effects is therefore a many-to-many
relationship system.
- Each source contributes to multiple pollutants, and
- each pollutant contributes to multiple health outcomes.
- each pollutant contributes to multiple health outcomes.
- This complexity is why air pollution cannot be understood through intuition alone and why mapping, data analysis and systems thinking are essential.
Sources, Pollutants and Health Impacts Pathways
London Data Week | Camden Colab Github Notebook
Google Colab Notebook link
colab.research.google.com/drive/1On4wfqxvFduKTYHHoyCWIPxo7JZ1Iiku?usp=sharing
https://colab.research.google.com/drive/1On4wfqxvFduKTYHHoyCWIPxo7JZ1Iiku?usp=sharing